Find who you compete with (Analyze)
Use the guided Analyze wizard to pick a community and a project type, see your ten closest competitors, run a head-to-head against any of them, read your scorecard against the whole set, and save the result as a compete report.
Before you start
- Analyze is a sidebar area inside Insights, separate from Explore. Where Explore's Compare lets you line up locations you already picked, Analyze works the other way around: tell it your community and the kind of project you chase, and it finds your competitors for you. See Compare locations if you already know who you want to line up.
- Analyze works at three geography levels: States, Metros, and Counties. Cities are not available here.
- Counties load a larger dataset than states or metros, so switching to Counties can take a moment the first time. While it loads the picker reads Loading counties…; if it fails you'll see County data unavailable.
- The wizard is five numbered steps. The weights, formulas and thresholds behind them are on How Analyze picks and ranks your competitors.
Steps
Choose your community
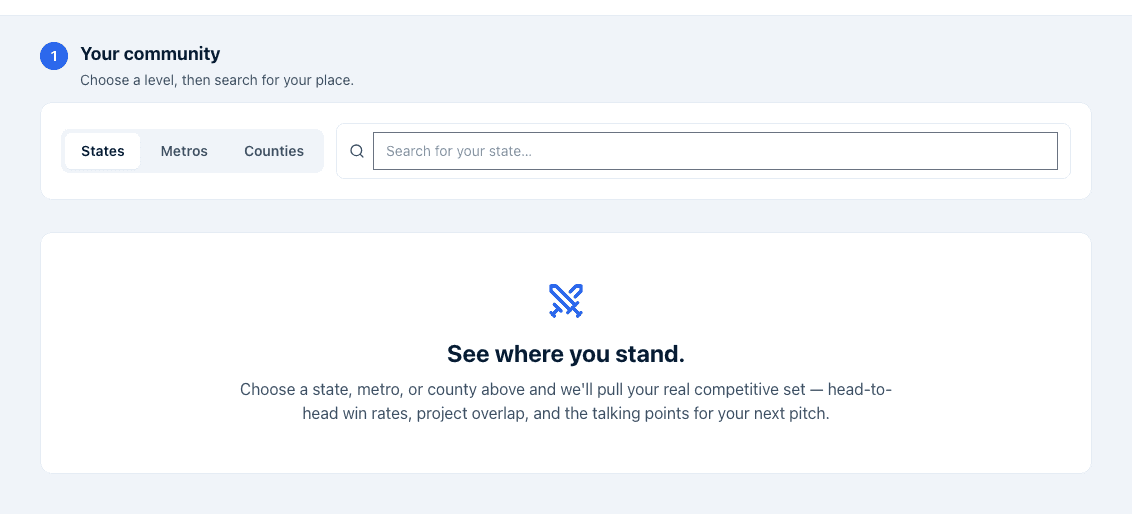
- Under Your community, click States, Metros, or Counties to pick a level.
- Type into the search box (Search for your state…, …metro area…, or …county…) and click a result to select it. Your choice appears in a highlighted card with its population and overall score. Click Change to pick a different community.
Until you pick one, the page shows See where you stand. — "Choose a state, metro, or county above and we'll pull your real competitive set."
Pick what you're competing for
- Under What are you competing for?, click one of five persona cards.
Each weighs the same five layers — Cost, Workforce, Risk, Quality of Life,
and Regulatory — differently, depending on the kind of project:
- Manufacturing — Plants and production lines where operating costs decide the deal.
- Tech & innovation — Software, R&D, and digital teams that follow the talent.
- Distribution & logistics — Warehouses and freight operations that need cheap, connected ground.
- A bit of everything — A general read across costs, people, and quality of life. Selected by default.
- Headquarters & offices — Corporate offices weighing livability and professional talent.

The exact weight each project type puts on each layer is published in Project-type weights.
Read your competitive set
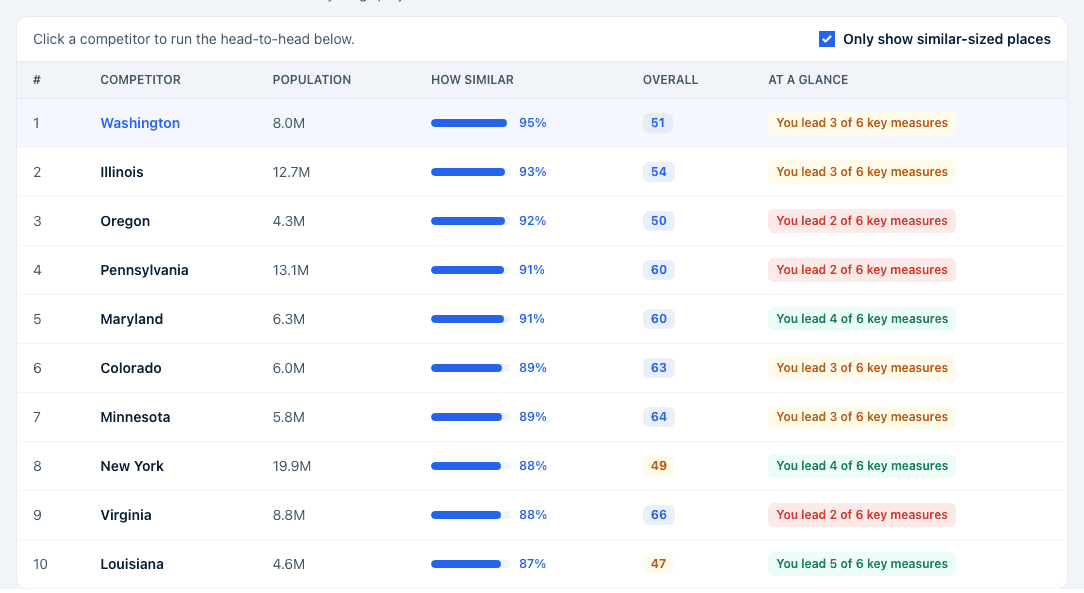
Once you've picked a community and a persona, Your competitive set lists up to ten competitors: the locations most like yours for that kind of project. Columns are #, Competitor, Population, How similar, Overall and At a glance. How similar compares your location with each candidate across the same five layers, giving the most weight to the layers the persona cares about most; the candidates that land closest to you rank highest. At a glance shows a win count such as "You lead 4 of 6 key measures" for that project type.
- Leave Only show similar-sized places checked to keep the set to competitors roughly a third to three-and-a-half times your population (in either direction); uncheck it to see the closest matches regardless of size. If nothing fits the band, the table reads No similar-sized places found — try unchecking "Only show similar-sized places".
- Click any row to run the head-to-head against that competitor below. The closest match is selected by default.
Read the head-to-head
Clicking a competitor opens a head-to-head section with:
- Where you win and Where they beat you — plain-language call-outs for every key measure that isn't a tie, biggest gap first. The Where they beat you card is hidden entirely when there is nothing to show, and if neither side has an edge the first card reads "No clear edge on this project type's key measures — lead with incentives, sites, and relationships instead."
- Incentive firepower (states only) — compares the two states' tracked incentive activity, with an Incentive Competitiveness Score (ICS) badge and total tracked award value for each side, above a sentence reading "You lead / trail / match <rival> on incentive competitiveness — ICS X vs Y." It appears whenever both states have an incentive score on record; a state with limited disclosure still appears, with its ICS badge greyed.
- A full measure-by-measure table — Measure, You (<your community>), the competitor, and Who leads reading You, Them, or Even.

Read your scorecard vs. this set
Step 5, Your scorecard vs. this set, is subtitled "What to open your pitch with — and what competitors will raise." It stops comparing you with one rival and ranks you against all ten at once.
- Two pills summarise it: Lead with (across your full peer set) lists every measure where you're in the top third or outright first, and Watch (across your full peer set) lists every measure where you're in the bottom third or outright last. Neither is padded — if nothing is genuinely strong, the Lead with pill doesn't appear.
- The table below shows Measure, Your value, Competitor median and Your rank ("3rd of 11" — you plus every peer with a usable value), with a green, amber or red dot for which third you're in.
- A right-to-work row has no rank; it reads N of M competitors are right-to-work instead.
Generate a report
- Once your competitive set is showing, click Generate Report to open the Competitive Position Report, subtitled with your community, your project type and the number of peers. It opens with four KPIs — Overall score (of 100), Rank in set, Closest match, Peers analyzed — followed by Your Competitive Set, How You Stack Up (a radar of your five layers against the peer median plus a composite-score bar chart across the set), up to two Head-to-Head tables, and The Bottom Line. Back returns you to the wizard.
- From the report, click Download Report to generate and save a PDF. A Report PDF saved toast confirms it and the PDF opens in a new tab.
If you click Download Report in the first moment after the report opens, before its history record has finished saving, it opens your browser's print dialog instead — you can still choose "Save as PDF" there, but the file won't be attached to the history row. Wait a couple of seconds and click again to get the saved PDF.
What happens next
- Opening the report also records it in your account's report history in the background — you don't need to click Save first. It shows up as a Compete Report in Reports → recent history, tagged with the Analyze surface.
- A compete report's history row has no in-place "Open" the way other saved reports do; instead it shows Open in Analyze, which sends you back to the wizard to rebuild the view. Rebuild your community, persona, and competitor selection the same way to get back to where you left off. Once Download Report has saved a PDF, a PDF link appears on that row.
- Switching levels, changing your community, or picking a different persona clears your current competitor selection and head-to-head, so you start the read-through again from your competitive set.
Economic development organizations typically pick their own state, metro, or county, then choose the persona that matches the kind of prospects they're chasing (Manufacturing for a plant relocation, Tech & innovation for an R&D project) to see who they're really up against for that project type before a pitch.
Site selectors typically run Analyze from a client's leading candidate location rather than their own community — enter the client's top pick as "your community" and match the persona to the client's project type to surface look-alike alternatives worth adding to the shortlist.
Common questions
Q: Why is a neighboring county not showing up in my competitive set? A: The set ranks every county at the level by how close its Cost, Workforce, Risk, Quality of Life, and Regulatory scores are to yours for the persona you picked, not by geographic distance. A nearby county can still be a poor match if its scores diverge, while a county across the country with a similar economic profile can outrank it. Try a different persona if you expected a specific project type to change the ranking.
Q: Why does the incentive firepower card only show up sometimes? A: It's states-only, so it never appears at Metro or County level. Even at State level it's hidden if one of the two states has no incentive score on record at all. A state with limited disclosure does still appear — its ICS badge is greyed to tell you the score leans on national fallbacks.
Q: What are the actual weights behind each project type? A: They're published in full on How Analyze picks and ranks your competitors, along with the similarity formula, the population band, and which measures each project type compares at each level.
Q: What is "Your scorecard vs. this set" and how is "Your rank" computed? A: It's the last step of the wizard, and unlike the head-to-head it compares you with all ten competitors at once. Your rank on a measure is 1 plus the number of places in that group that beat you on it, shown as "3rd of 11". The top third of positions becomes Lead with, the bottom third Watch.
Q: Why is the head-to-head table shorter for a metro than for a state? A: Some measures only exist at state level — freight volume, for instance — so they drop out of a metro or county comparison, and a couple are swapped for level-appropriate equivalents. The per-level lists are on How Analyze picks and ranks your competitors.
Q: Can I choose my own competitors instead of the ones Analyze picks? A: Not inside Analyze — it's built to find your competitive set for you. If you already know who you want to compare, use Compare inside Explore instead, where you pick every location yourself. See Compare locations.
Q: Why did Download Report open my browser's print dialog instead of saving a PDF? A: You clicked it before the report's history record had landed. The print dialog is the fallback so you're never stuck without a copy. Go back, wait a couple of seconds and click Download Report again — you should get the Report PDF saved toast.
Q: Does the compete report PDF match the screen exactly? A: Yes, with caps: 25 competitive-set rows, at most two head-to-head tables of 15 rows each, and four Bottom Line points. Nothing is recalculated — the PDF captures what's on screen.
Q: I generated a report, but now I can't find it. Where did it go? A: Check Reports → recent history for a row labeled Compete Report; it's tagged with the Analyze surface and named after your community. Click Open in Analyze to return to the wizard — this reopens the wizard rather than the exact report, so pick the same community and persona to rebuild the view.
Q: Why did my competitive set change when I unchecked "Only show similar-sized places"? A: That checkbox filters candidates to between 0.3 and 3.5 times your population before ranking them. Turning it off widens the pool to every location at the level, so closer-matching but very differently sized places can now outrank similar-sized ones that showed up before.
Related
Last updated on