Incentive Intelligence: awards and programs
Explore Incenti Subsidy Intelligence, a proprietary dataset of disclosed incentive awards across 51 jurisdictions, alongside the Programs Offered catalog of verified current state programs, competitiveness scores, megadeals, and company deal comps.
Before you start
- Your account needs the Insights product. If your workspace switcher doesn't show Insights, ask an account admin to check your product access.
- Open Incentives from the Insights sidebar (alongside Ask, Explore, Analyze, and Reports). The screen is branded Incentive Intelligence, subtitled "Proprietary subsidy data across 51 jurisdictions."
- This screen covers two different datasets. Awards (the Overview, Map, Compare, Industries, Companies, Megadeals, and Explorer tabs) is Incenti's proprietary compiled record of disclosed historical incentive deals — what companies actually won. Programs Offered (the Programs tab) is a separate, verified catalog of the incentive programs each state currently offers. The two are not the same list: an award on record doesn't guarantee the program that produced it is still active, and a listed program doesn't guarantee any company has taken it yet.
- Every formula, threshold and refresh rule behind the numbers on this screen is on one page: How Incentive Intelligence figures are computed.
Steps
Incentive Intelligence has eight tabs: Overview, Map, Programs, Compare, Industries, Companies, Megadeals, and Explorer.
Use Incentive Intelligence to benchmark your own state's competitiveness against peers on Compare and the Map, see what competing states actually awarded to land specific companies, and pull comps from Companies or Megadeals when you're building your own case to a prospect. Programs Offered doubles as a check on what nearby states are currently offering.
Use Incentive Intelligence to see what a company like yours has actually received in similar deals (Companies, Megadeals, Explorer), which states run the most generous or active incentive environments (Overview, Map, Compare), and to discover which specific programs a candidate state currently offers on the Programs tab before you approach it.
Overview
The landing tab. Four KPI cards summarize the awards dataset:
- Tracked Value (2008+, normalized), with the count of disclosed awards and the note "megadeals excluded". If the normalized view is unavailable, this card falls back to Total Tracked Value over all years instead.
- Megadeals — how many bundled megadeals are on record, and their combined value.
- Corporate Parents — parent companies on record, with the count of recipient entities beneath them.
- Year Range — the span the dataset actually covers and how many jurisdictions. With a Years range set, this card relabels to Selected Range and the Megadeals and Corporate Parents subtitles gain "· all years" to show they haven't moved.

Below the KPIs:
-
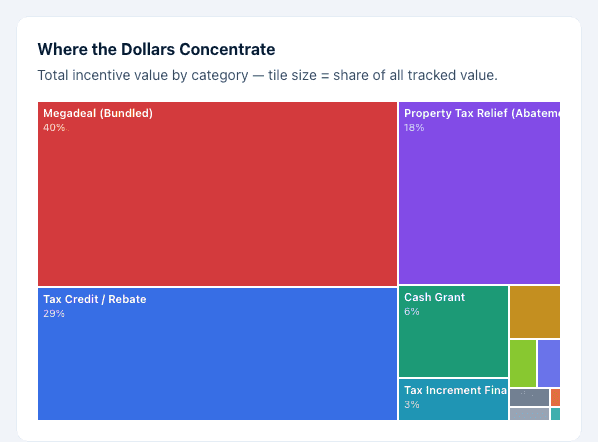
Where the Dollars Concentrate — a treemap of normalized incentive value by category, tile size showing each category's share of normalized value.
-
Annual Award Value — a line chart of tracked value by year.
-
Momentum Leaders — the 6 states with the largest share of their lifetime incentive value awarded in the last five years. Click a state to open its profile.
-
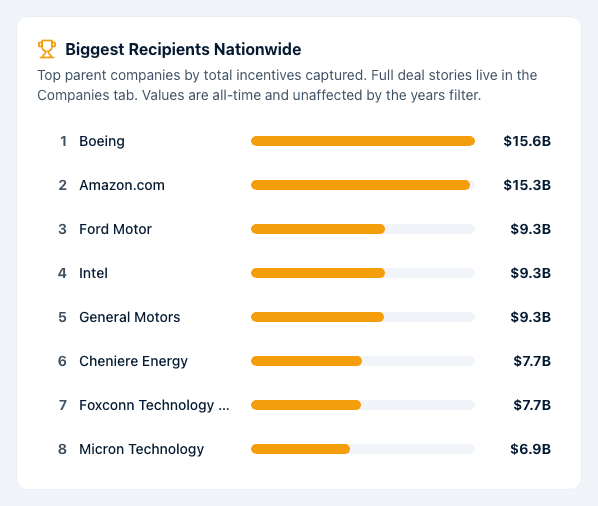
Biggest Recipients Nationwide — the top 8 parent companies by total incentives captured, with full deal stories on the Companies tab.
-
Incentive Competitiveness Score — State Rankings — every state and DC ranked by ICS, with its tracked value, an amber warning icon where disclosure is limited, and a capped badge where the source extract's per-state record cap applies. Click any state to open its profile.
The Incentive Competitiveness Score (ICS) is a 0–100 composite of four weighted components: Typical Award Size (25%), Large-Award Share (30%), Recency — the share of value awarded since 2020 (20%) — and Category Diversity (25%). States with limited disclosure fall back to national medians for part of the score and are flagged wherever the score appears.
The Years selector
A Years control — From and To dropdowns, each with an All years option and a Reset link once you've narrowed it — appears on Overview, Compare and Explorer. Its hint reads "Applies to tracked value, category mix, annual trend, and momentum."
- On Overview and Compare the earliest year you can pick is 2008, the start of the normalized window. The range moves tracked value, the category mix, the annual trend, momentum, and the dollar column in the state rankings. ICS, Large-Award Share and the ICS component breakdown stay computed across all years, and a footnote says so.
- On Explorer the range goes back to 1974 and filters the individual award records directly.
- The Industries tab has its own pair of plain year selects with no "All years" option, defaulting to the full 1974–2025 span.
- A state profile's Year Trend card has its own separate Years selector.
Biggest Recipients Nationwide is explicitly all-time and never moves.
How this is normalized
Every blended dollar figure on this screen — Tracked Value, the category mix, the annual trend, per-state value and medians — is normalized: awards from 2008 onward only, bundled megadeals excluded, and extreme outliers capped at the 99.9th percentile. A footnote beginning How this is normalized: appears on Overview, the Map in ICS mode, Compare, Explorer and each state profile, printing the live figures behind those three rules.
Raw all-time numbers still appear on Explorer (award records as reported) and on the printable State Report. That's why the same state can show two different totals. See How Incentive Intelligence figures are computed.
Limited disclosure, capped, and Unknown source
Three flags on this screen mean three different things:
| Flag | Where | What it means |
|---|---|---|
| Limited disclosure | Rankings, map, profile, Compare | Under $50M disclosed value or fewer than 30 awards; part of the ICS falls back to national medians |
| capped | Rankings, Industries by state, Explorer footer, exports | The source extract holds at most 10,000 records for that state, so its award set is likely incomplete and its counts aren't cross-state comparable |
| Unknown source | Explorer's Source column | The record didn't say which level of government granted it — not a doubt about the award itself |
Map
Shows the same state rankings as a choropleth. A Shade by control switches the fill between Shade by: ICS and Shade by: Programs offered. Click any state to open its full incentive profile.
In ICS mode the legend reads 0 — 100 and separately flags Limited disclosure states; hovering a state shows its ICS, a Limited chip where it applies, and its total value and award count.
In Programs offered mode the card title changes to Programs Offered and the legend changes with it: a scale reading Fewer — more programs with the maximum count, a hatched swatch for Partial coverage, a grey swatch for Coverage in progress, and the caution Program breadth ≠ award generosity. Hovering a state shows its program count, or "N verified so far" where coverage is partial.
Programs
Programs Offered: verified state incentive programs, separate from the awards dataset described above.
Pick a jurisdiction with the picker ("Search all 51 jurisdictions"). It keeps Recent: chips for your last five jurisdictions in your own browser, pressing Enter selects the top match, and typing a postal abbreviation like "ia" outranks plain substring matches. An unmatched search reads No jurisdiction matches "…".
Each program row shows a category badge, the program name (linking out to the program's own page), the administering agency, Benefit, Eligibility, and a Verified Mon YYYY date. A program that has ended carries a Sunset chip and renders muted; sunset programs are hidden unless you turn on Include sunset programs. There is no chip on a current program.
Filter by industry chips or by one of the six category groups — Tax Credit / Abatement, Cash Grant, Financing & Loans, Workforce / Training, Infrastructure, Exemption / Other — and clear everything with Reset filters. A count line reads N of M programs match the current filters; the list collapses to 6 rows with Show all N programs / Show fewer programs beneath it.
When you filter by industry, programs with no industry tags at all — general-purpose programs open to anyone — stay in the list but are not counted in "N of M match". That's why the list can be longer than the number.
Where coverage is incomplete you'll see one of two messages: Coverage in progress — N programs verified so far of an estimated M. More are still being verified, so this list is not yet complete., or, where nothing is verified yet, No verified programs for X yet with chips for the jurisdictions that do have programs available now.
Click Create report (top of the card, or the in-card scoped button once filters are active) to generate an Incentive Landscape report for the selected jurisdiction. See Reports and exports from the Incentives screen.
Compare
State Incentive Benchmarking: compare 2–4 states' incentive environments side by side. Click Add state to build the comparison — the picker shows each state's ICS N — up to four at once. Until you've added two, the tab reads Add at least two states to compare.
The comparison table shows ICS Score, Total Tracked Value, Typical (Median) Award, Large-Award Share, Awards on Record, and Dominant Category, with a ★ marking the leader on each row. Its footnote reads "★ group leader. Award counts aren't cross-state comparable where a per-state record cap applies." Below sit an ICS Component Breakdown (computed across all years), an annual value trend overlay, and What the Data Says narrative cards.
A Years range narrows most figures; ICS and Large-Award Share stay computed across all years regardless. Once two or more states are added, Export Report opens a printable benchmarking report.
Industries
Industry rollups of the awards dataset by industry classification scheme (NAICS 2022, the Census Bureau's North American Industry Classification System). Four KPI cards summarize the picture: Classified value (with its share of tracked value), Top sector, Sectors (how many of the 20 NAICS 2022 sectors have awards on record), and Unclassified (the dollar value and award count that couldn't be confidently placed).
A Years range narrows Classified value, Top sector and Sectors. It does not move the Unclassified KPI, and the Classified value card's share is always stated over all years — the subtitles read "· share across all years" and "· all years" to say so.
Below the KPIs, Incentive value by NAICS sector lists every sector that received incentives (no top-N cut-off), each row showing its award count, share of classified value, and total value. Shares are always stated over classified value, not total tracked value — the unclassified remainder is shown separately and never folded into a sector's share. A sector row tagged Cross-cutting covers a custom code for awards that don't map cleanly to one of the 20 standard sectors. Hovering a value shows how many undisclosed-value awards it includes (counted, $0 value). The "How to read this" note below the leaderboard spells out these rules and cites the classification scheme.
Click a sector to drill into it. A breadcrumb (All industries → sector → subsector → NAICS industry) tracks where you are, and each level shows a breakdown card (labeled with the current level, e.g. "Subsector breakdown") with a toggle to pivot By subsector/By NAICS industry (the next level down) or By state. A remainder row — Not classified beyond subsector or Not classified beyond NAICS industry — always appears alongside the breakdown so nothing classified at a shallower level goes missing. The By state view flags capped states, where the per-state record cap means that state's counts aren't directly comparable to an uncapped state's. Each level also shows an Industry × incentive type crosstab (rows are the child level, columns are incentive categories like tax credits or cash grants) with a $ / % of row toggle, and a Top recipients list of the 25 companies that captured the most value at that node. A node with nothing below it says so ("No deeper classifications below X yet.", or that a 6-digit code is the deepest NAICS level and it is showing the state breakdown instead).
Two export buttons sit next to the breadcrumb: Export current view as CSV (the level and pivot you're currently looking at) and Export all levels as XLSX (a workbook with a Read me sheet plus one sheet per level of your drill trail, from the sector down to where you are). Both respect the active Years range. File names, columns and caps are on Reports and exports from the Incentives screen.
Classification is a periodic background job over the whole awards dataset, not something your account runs. Until its first run has completed, the tab shows Industry classification hasn't run yet instead of the KPIs and leaderboard.
Companies
Company Deal Comps: search any parent company ("Search companies (e.g. Amazon, Intel, Boeing)...") to see every incentive it has captured nationwide, or browse Biggest Incentive Recipients, the top 25 parent companies nationwide by total incentives captured. Search needs at least two characters and shows ten results.
Click any company for its full deal story: hero KPIs (Total Captured, Awards, States, Typical Award) with its rank among all parents, What the Data Says story cards (national footprint, where the money lands, incentive playbook, deal momentum, anchor deal), an Award Timeline, Where the Money Lands (top 10 states), an Incentive Category Mix, and Largest Individual Awards (top 8). Back to companies returns to the leaderboard.
The Entities & Classifications card lists each entity under that parent tagged Parent entity or Subsidiary, with its NAICS industry code, label, and a confidence reading High, Medium or Low beside the numeric value — or — Not classified where no code was assigned. Each entity is classified on its own activity: a subsidiary doesn't inherit its parent's industry.
A company's detail page has its own Export Report button.
Megadeals
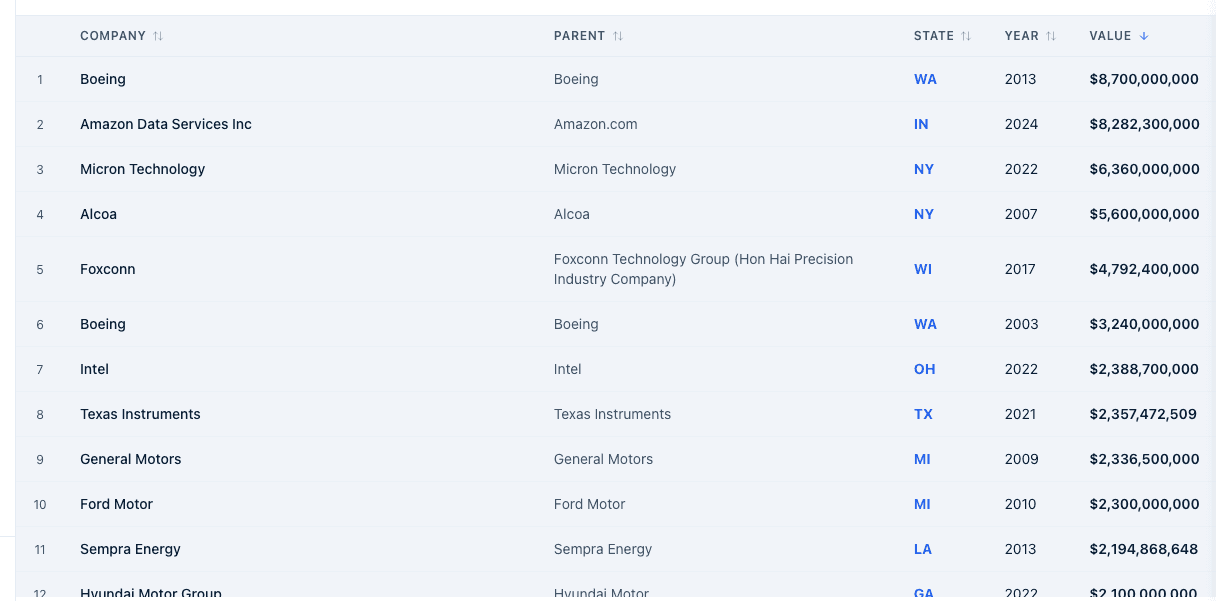
Megadeals Board: the largest bundled incentive deals, filterable by state and year (All States / All Years), searchable by company. Click a column header to sort. The header counts how many of the total deals match and their combined value, and the footer repeats the shown count. Click Export Report to open a printable Megadeals Briefing.
Explorer
Record Explorer: pick a state from Select State... to browse its individual award records. Once a state is chosen, filter by company search, category, tier, and a Years range, and sort any column (Company, Parent, Year, Value, Category, Tier, Source). Changing the state clears the other filters.
Up to 500 rows show at once; the footer reads Showing 500 of N awards when there are more, and adds Per-state cap applies; counts not cross-state comparable for a capped state and Raw records shown as reported; blended dollar aggregates elsewhere use the normalized view. With no matches it says No awards match these filters — Try widening the search, category, tier, or timeframe filters.
Click State Report to open a printable summary of the state's incentive landscape. It does not export the records on screen.
What happens next
-
Clicking a state anywhere (Map, Overview rankings, Momentum Leaders) opens that state's incentive profile: Incentive Competitiveness Profile KPIs with any Limited disclosure or Per-state cap applies flags, a Large-Award Share read of Strategic + Transformational value, ICS Component Scores, a Category Mix rolled into the six display groups, a Year Trend with its own Years selector, Top Recipients in XX with curated industry chips, Megadeals in XX, and a Programs Offered card (a 6-row preview of the same catalog shown on the Programs tab, with View all N programs). Back to Overview returns you.
-
Only Create report on the Programs tab saves anything to your account's Recent reports. Export Report on Compare, Companies and Megadeals, and State Report on Explorer, open printable reports that are never saved — their Download Report button is your browser's print dialog. See Reports and exports from the Incentives screen.
-
Explore's detail panel carries a compact Incentive Environment card and a Programs Offered mirror of this screen's catalog, noting that "Incentive data is state-level; figures reflect the entire state, not this county."
Common questions
Q: Where does this data come from? A: The awards side is Incenti's own proprietary compiled dataset of publicly disclosed incentive awards across 51 jurisdictions, going back to 1974, re-ingested whenever a new extract lands. The Programs Offered catalog is a separately maintained, verified list of current state incentive programs, re-verified on a rolling 12-month cycle.
Q: Why is the Tracked Value smaller than what I saw on the printed State Report? A: The Overview KPI is the normalized figure — 2008 onward, bundled megadeals excluded, extreme outliers capped. The Explorer's State Report prints the raw all-time total instead. Both are correct; use the normalized one when comparing states. See How Incentive Intelligence figures are computed.
Q: Why is a state marked "capped" or "Limited disclosure"? A: Capped means the source extract holds at most 10,000 records for that state, so its award set is likely incomplete and its award count isn't comparable to an uncapped state's. Limited disclosure means the state has under $50 million in disclosed value or fewer than 30 disclosed awards, so part of its ICS falls back to national medians; it's flagged wherever the score appears.
Q: How is the ICS calculated? A: Typical Award Size 25%, Large-Award Share 30%, Recency (share of value awarded since 2020) 20%, and Category Diversity 25%, each scored 0–100. It's computed over the raw all-time dataset, so the Years filter never changes it. The full definition is on How Incentive Intelligence figures are computed.
Q: Why doesn't the Years filter change the Biggest Recipients list? A: That card is explicitly all-time by design, so a fixed answer to "who has captured the most, ever" stays stable no matter what range you've set elsewhere on the page. The Unclassified KPI on Industries is all-time for the same reason.
Q: Why does the Industries Years filter start at 1974 but Overview only offers 2008? A: Overview's blended dollar figures are normalized to a 2008-onward window, so offering an earlier start would produce a range the figures can't honour. Industries and Explorer work over the raw records, which really do go back to 1974.
Q: Does this include local (city and county) incentives, or only state programs? A: Both, on the awards side. Each award is tagged by the level of government that granted it, and the Source column in Explorer reads State, Local or Unknown. "Unknown" just means the level wasn't recorded — it isn't a doubt about the award. Programs Offered, by contrast, lists state-level programs only.
Q: Why does the Programs map show my state hatched or grey? A: Hatched means Partial coverage — some programs are verified but the list isn't complete yet. Grey means Coverage in progress — nothing is verified for that state yet. Neither means the state offers few programs; the legend's "Program breadth ≠ award generosity" note makes the same point about the shading scale.
Q: Why does the Programs tab say "12 of 30 programs match" but list more? A: General-purpose programs with no industry tags stay in the list because they genuinely are open to your industry, but they aren't counted as industry-specific matches. The count is only the programs tagged to the industry you picked.
Q: Is my own account's incentive program listed under Programs Offered? A: Programs Offered is a separate, independently verified catalog and isn't built from what your account manages in Programs. If your account is an economic development organization, the incentive programs you administer under Programs in the main workspace are managed there, not here.
Q: Why is so much value "Unclassified" on the Industries tab? A: Some award recipients can't be confidently placed into a NAICS 2022 sector, and those stay in the always-shown unclassified remainder rather than being guessed into a sector. The Classified value KPI and every sector's share on the leaderboard are stated over classified value only, so the unclassified amount never dilutes a sector's share — it's shown separately instead.
Q: Why does "Top Recipients in TX" show a Sector for some companies and not others? A: Those Sector chips come only from manually curated labels, not from the automated NAICS classification, so most recipients don't have one. An industry chip with no curated matches says "No company-level leaders identified for this segment yet".
Q: Why does searching Companies for a company I know find nothing? A: The search matches parent company names, needs at least two characters, and returns ten results. Try the shortest distinctive part of the parent name ("Tesla" rather than "Tesla Motors Inc"), or look for the subsidiary under its parent's Entities & Classifications card.
Q: Can I filter the rest of Incentive Intelligence by industry? A: Industry filtering itself lives on the Industries tab (drill by NAICS sector, subsector, or industry) and, separately, as industry chips on the Programs tab for narrowing which offered programs match an industry. The Map, Compare, and Explorer tabs don't filter by industry or NAICS code.
Related
Last updated on