Insights overview and data coverage
Understand what Insights is, how to get to it, what each sidebar area does, the geography levels it covers, how scores work at a glance, and what is and is not included in the data.
Before you start
- Insights is a separate product from your account's forms, contacts, and pipeline data. It is granted per account, so it only appears in the header workspace switcher if your account has it.
- Insights covers public economic, workforce, cost, risk, quality-of-life, and regulatory data for U.S. states, metros, counties, and cities; the coded priorities of every EDA-designated Economic Development District; and Incenti's own incentive-award dataset, Incentive Intelligence.
Steps
Open Insights and pick a starting point
- Click the workspace switcher in the header and choose Insights.
- Use the sidebar to pick where to start: Ask, Explore, Analyze, Incentives, or Reports.
- Going directly to
/insightstakes you to Explore, since it's the default landing page for the module.
What each area does
- Explore is the map and table view of states, metros, counties, and cities, plus an Economic Development District overlay. Pick a geography level, click a location, and see its metrics and — at State, Metro, and County level — its computed scores. Selecting more than one location opens a side-by-side comparison. See Explore a location and Compare locations.
- Ask is a conversational interface for questions about locations, cost, workforce, risk, incentives, or site-selection strategy, answered from the same data. See Ask Insights.
- Analyze is a guided competitive-analysis wizard that helps you work out which states, metros, or counties you compete with and on what. See Analyze your competitive set.
- Incentives is Incentive Intelligence: Incenti Subsidy Intelligence award data across 51 jurisdictions, covering disclosed awards, recipients, megadeals, and the programs each state offers. See Incentive Intelligence.
- Reports generates downloadable profile and comparison reports for states, metros, counties, districts, and cities, plus incentive reports, and keeps a history of the reports you have generated. See Create and export Insights reports.
Geography levels
Explore, Compare, and Reports all work across four geography levels, plus the Economic Development District overlay. Each level is built from the metrics its sources actually publish at that grain, so the catalogues are not subsets of one another:
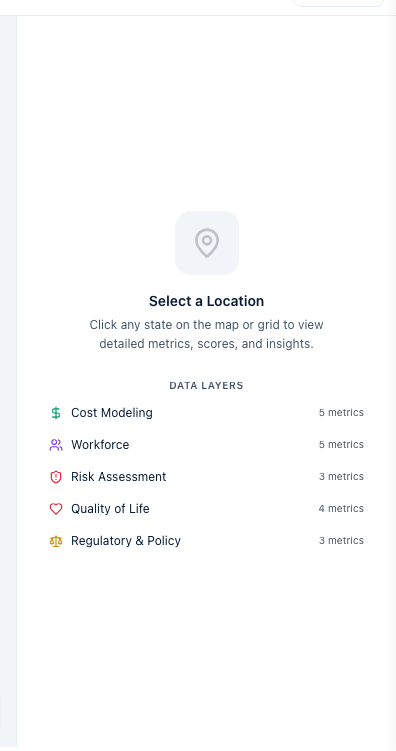
- State: the 50 states, from 26 required metrics — 20 of them spread across the five data layers (Cost Modeling, Workforce, Risk Assessment, Quality of Life, and Regulatory & Policy), and six Site Screening figures such as population, median age, and poverty rate that are shown but not scored.
- Metro: every Metropolitan Statistical Area with a complete set of its 18 required metrics — hundreds of metros, not just the largest ones. Four Regulatory metrics come from the metro's state, and two health metrics exist for 34 large metros only.
- County: U.S. counties, across 24 indicators in five data layers. Some county values are modelled rather than measured — see below.
- City: about 32,000 incorporated places and census-designated places, each tied to a principal county, with 14 city-level indicators and no scores.
- EDD regions: 404 EDA-designated Economic Development Districts with their coded strategy priorities, reached from a chip on the State-level toolbar. See Explore EDD regions.

What each level actually covers
- A state is served only when all 26 of its required metrics are present. A state missing one is left out of that refresh cycle entirely rather than shown with a gap, which is why the Benchmarks section reads Ranked #X of N states rather than always "of 50".
- A metro works the same way: complete snapshot or not served.
- A county is always shown. Where a source publishes nothing for it, the field falls back to a modelled value derived from its state.
- A city shows — for any indicator the Census withholds at that population size, and never fills the gap from its county.
- Washington, D.C. appears at City level and in Incentives, but is not a state, metro, or county. Puerto Rico appears only in the EDD overlay. Other U.S. territories are not covered.
Detail is in County and metro data quality and City-level data.
Scores
At State, Metro, and County level every location gets a Composite Score plus five category scores: Cost Score, Workforce Score, Risk Score, Quality of Life Score, and Regulatory Score. Each category score is a weighted blend of that location's own metrics in the category, with each metric scaled to a 0 to 100 range against fixed bounds, so a score depends only on the location's own numbers, not on which other locations are loaded.
The Composite Score blends the five category scores — equally at State level, but weighted Workforce 25%, Risk 15%, and 20% each for Cost, Quality of Life, and Regulatory at Metro and County level. A higher score is always better, including Risk Score, where a high number means less exposure. Metrics where a lower raw value is better (unemployment, disaster count, crime) are inverted before blending. City level lists its indicators directly and has no scores.
Score badges are coloured by value alone: green at 70 and above, blue at 50–69, amber at 35–49, and red below 35.
The full formulas, weights, and scaling ranges are in How Insights scores are calculated.
How current the data is
Metric ingestion runs monthly, one geography level per day: states on the 2nd, metros on the 3rd, counties on the 4th, and cities on the 5th, at 06:00 UTC. Map boundaries refresh once a year. EDD priorities and the incentive award dataset are not on a schedule at all — they update when a new extract is loaded.
A monthly run does not mean every number changes monthly. Most sources publish annually or semiannually, and six state fields have no machine-readable publisher at all, so they are transcribed by hand and stay fixed until someone updates them.
Insights does not display a "last refreshed" date. The only place the product prints a source and period per number is the More indicators section of a city's detail panel and the expanded row of the Metro table. The full source-and-cadence catalogue lives in Where Insights data comes from and how often it refreshes.
Screen size
The right-hand detail panel and the TOP 5 card are hidden on narrow screens. On a phone or a small window you get the map and table but no detail panel, so use a laptop-width window when you need to read a location's metrics, scores, or benchmarks.
What Insights does not cover
- Washington, D.C. and U.S. territories are not covered as states, metros, or counties.
- Scores, benchmarks, and the SWAT Analysis summary exist at State and County level. Metro has scores and metrics but no Benchmarks, Insights, or SWAT sections; City has none of them.
- Where a metric has no value for a city, it shows as unavailable rather than being filled in from the county. At county level, a field with no published source falls back to a modelled value instead.
- Insights is public and proprietary reference data, not your account's data. You cannot edit it, and it does not include your own contacts, responses, or opportunities. Combining Insights with your own records happens through the rest of the product (for example, linking a property or opportunity to a location), not by editing Insights data itself.
What happens next
- Nothing you do in Insights changes your account's data. Filters, view modes, and Metro, County, and City selections last only while you stay on the screen.
- At State level your selection is written into the page URL as
?states=, so it survives a reload and comes back when you return to State level. Only Ask conversations and generated reports are stored. - Opening Create report records an entry in your Reports history straight away, before you download anything.
- Data refreshes arrive in the background on the monthly schedule above. You do not need to do anything to receive them.
Economic development organizations typically use Insights to make the case for their own region: pulling their state, metro, or county's scores and metrics to market the location to prospects, and using Explore and Compare to benchmark against competing locations a prospect is also considering.
Site selectors typically use Insights to narrow down candidate locations for a client's project: filtering and comparing states, metros, counties, and cities on cost, workforce, and risk factors, then using Ask or Reports to build the analysis into a deliverable.
Common questions
Q: Why doesn't my county show a value for a metric? A: Counties always appear, so a county rarely shows a blank. Where a source publishes nothing for that county, the field falls back to a modelled value derived from its state rather than a measured one, and the product does not mark which is which. See County and metro data quality before quoting a county figure in a client document.
Q: How often is the data refreshed? A: Monthly, one level per day — states on the 2nd, metros on the 3rd, counties on the 4th, cities on the 5th. Six state fields are transcribed by hand and never refresh on that cycle, and the EDD and incentive datasets update only when a new extract is loaded. There is no "last refreshed" date shown anywhere in the product.
Q: Can I add my own data to Insights? A: No. Insights is public and proprietary data covering real U.S. geography; it is not editable and does not contain your account's contacts, responses, or other records. You can reference a location's Insights data alongside your own records elsewhere in the product, but you cannot change what Insights shows.
Q: Why is Washington, D.C. missing at the state level? A: Insights' state level covers the 50 states only. D.C. has no state, metro, or county row, though its places do appear at City level and it is a full jurisdiction in Incentive Intelligence, which covers 51 jurisdictions.
Q: Why is a location's score red? A: Score badges are coloured by the number alone: green at 70 and above, blue at 50–69, amber at 35–49, and red below 35. A red badge means that dimension scored under 35 for that location; it is not a data error. See How Insights scores are calculated.
Q: Does a higher Risk Score mean more risk or less? A: Less. Every score runs so that higher is better, so a high Risk Score means fewer disaster declarations, better air quality, and a better health ranking.
Q: Do you use AI to write the Insights and AI Analysis cards? A: No. The Insights, Benchmarks, SWAT Analysis, and City AI Analysis sections are all generated by fixed rules from the numbers on the page, so the same data always produces the same wording. The Ask area is the conversational part of Insights.
Q: What does the "No insights data available" banner mean? A: It means the environment you are in has no ingested geographic data yet, so the state and metro views will be empty until the ingestion pipelines have run. The Incentives area reads a separate dataset and may still have data. If you see this on your live account, contact support.
Q: Where is the detail panel on my phone? A: The right-hand detail panel and the TOP 5 card are hidden below a certain window width. Widen the window or use a laptop to see a location's metrics, scores, and benchmarks.
Related
Last updated on